ePlatform provides real-time data to help you understand how your library is being used. Whether you need to justify your budget, track reading progress, or guide your next book purchase, the analytics and reports area offers a comprehensive view of your school's digital reading habits.
Video Tutorial
We have created comprehensive video playlists to guide you through every feature. Whether you need a quick "how-to" on a specific topic or a full walkthrough, these are great resources to have on hand:
Overview
The Overview tab provides a high-level summary of your school's engagement with ePlatform. It is the perfect place to start if you need a quick snapshot of library performance for a staff meeting.
Summary
At the top of the page, you can see four key metrics that summarise your library's current reach:
- Total Loans: The total number of loans for the time period.
- Total Reserves: The total number of reserves for the time period.
- Active Patrons: A patron is active if they've borrowed or reserved at least one title.
- Active Titles: A title active if borrowed, reserved or previewed at least once.
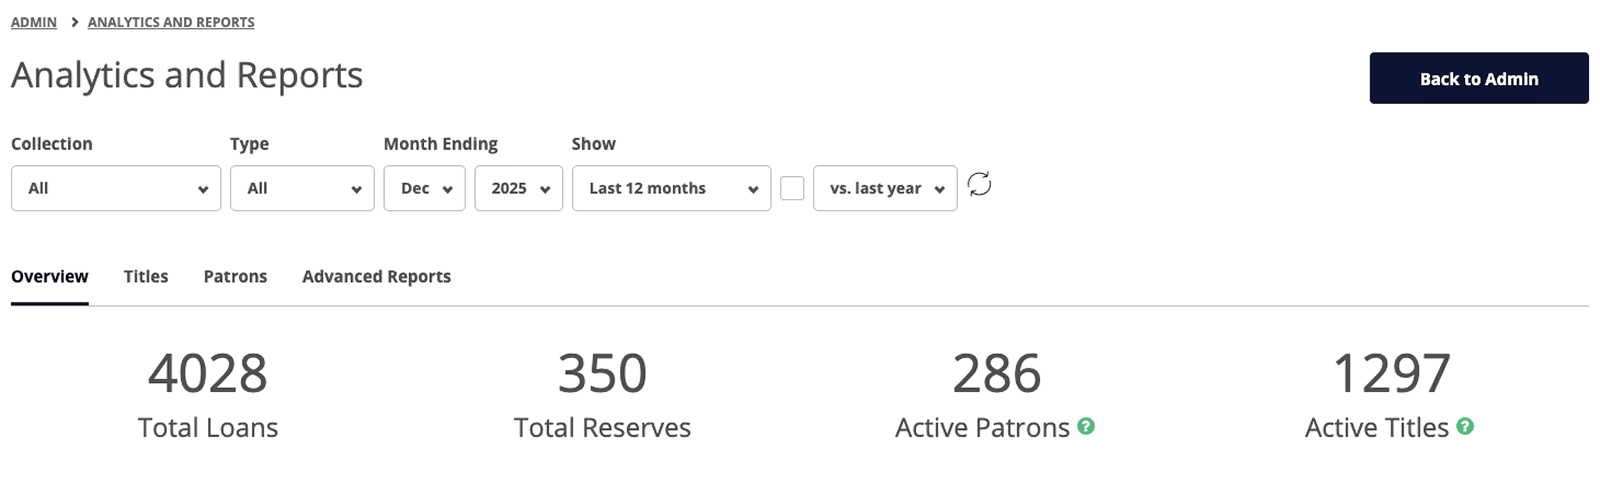
Loans/month
View your borrowing trends, broken down by format: eBooks (Private Titles), Shared eBooks, Audiobooks (Private Titles), and Shared Audiobooks.
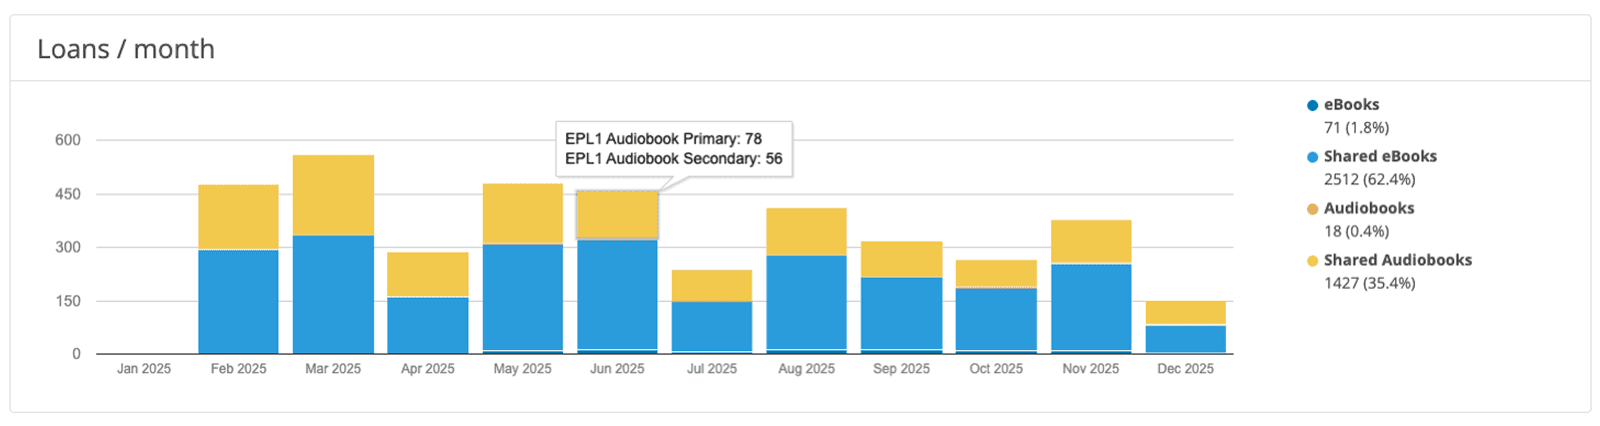
Reserves/month
Identify months with high demand where students are waiting for popular titles.
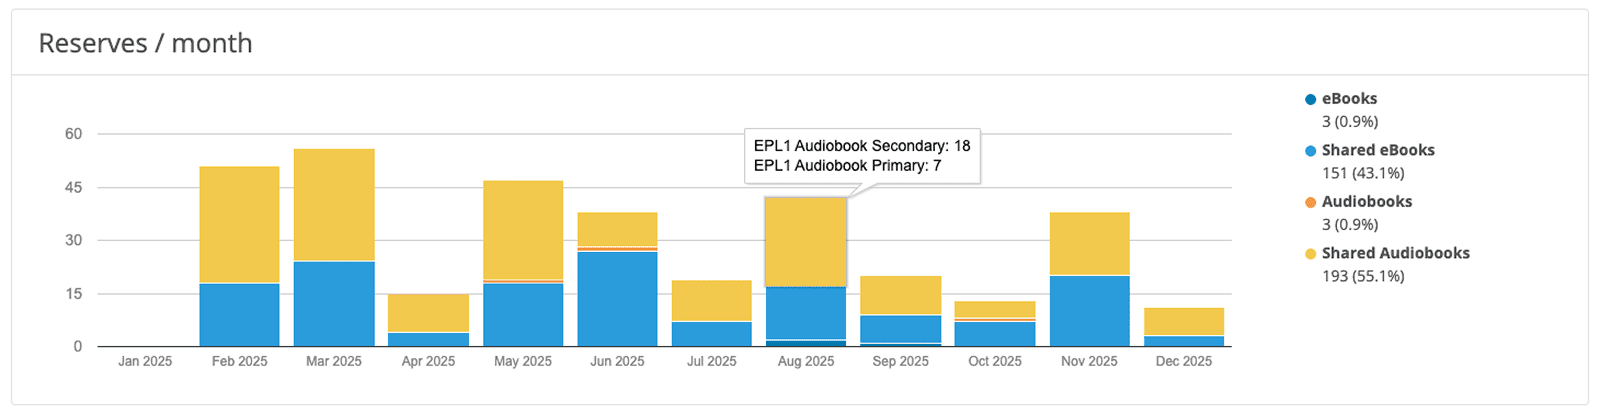
Previews/month
See how often students are sampling books before deciding to borrow them.
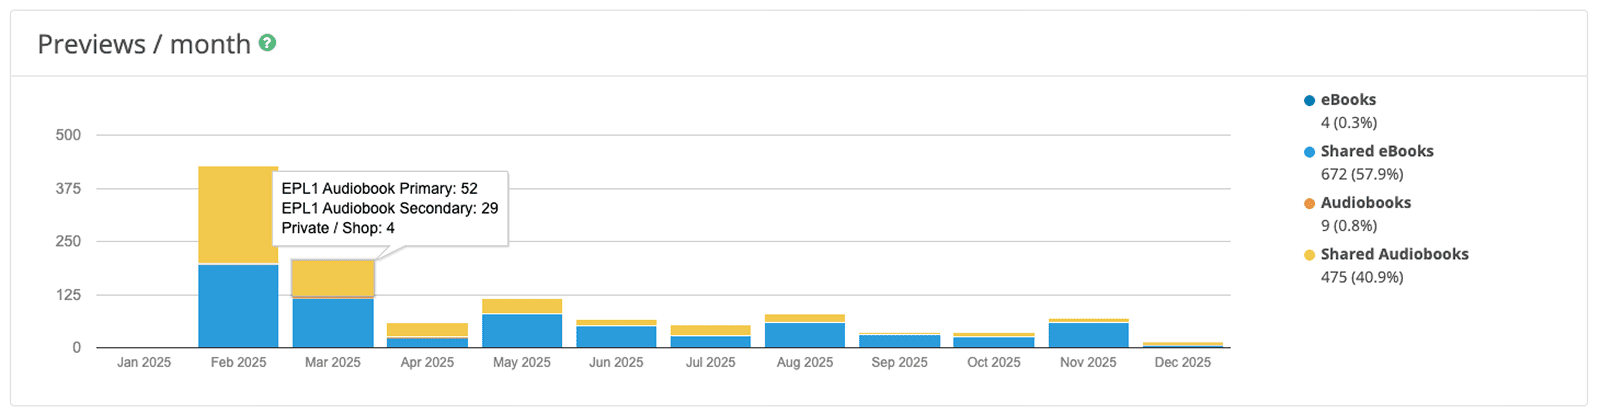
Usage by Application
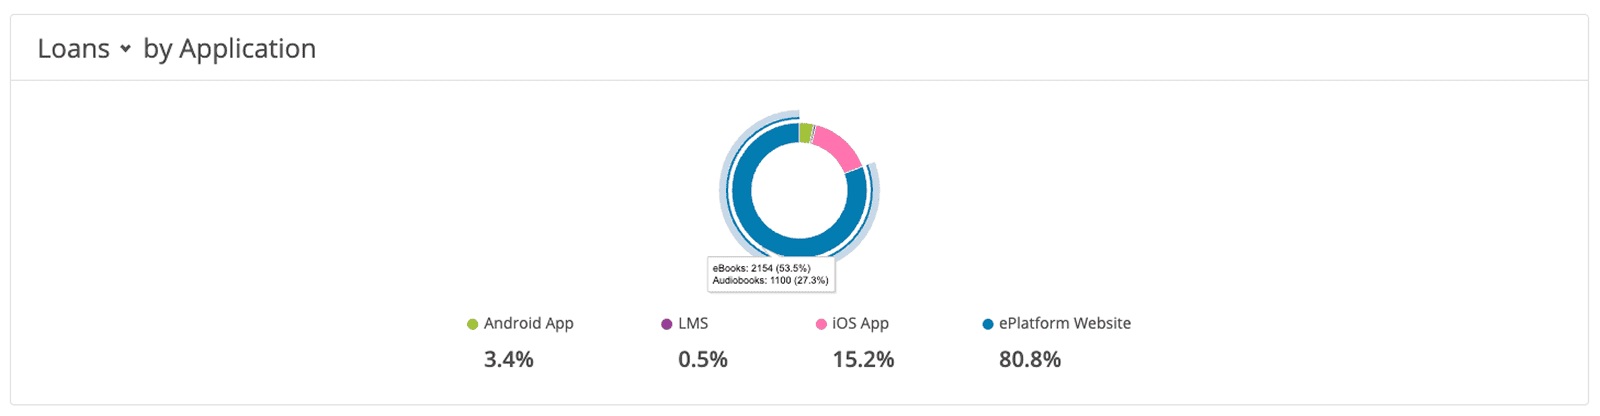
This donut chart shows you exactly how your students are accessing their books. You can toggle between Loans and Reserves to see if students prefer using the ePlatform Web Portal, the Android/iOS Apps, or via your school's LMS.
Titles
The Titles tab allows you to dive deeper into your collection's performance to see exactly which books are resonating with your students. This data is invaluable for identifying popular series and determining where to allocate your future budget.
Titles Table
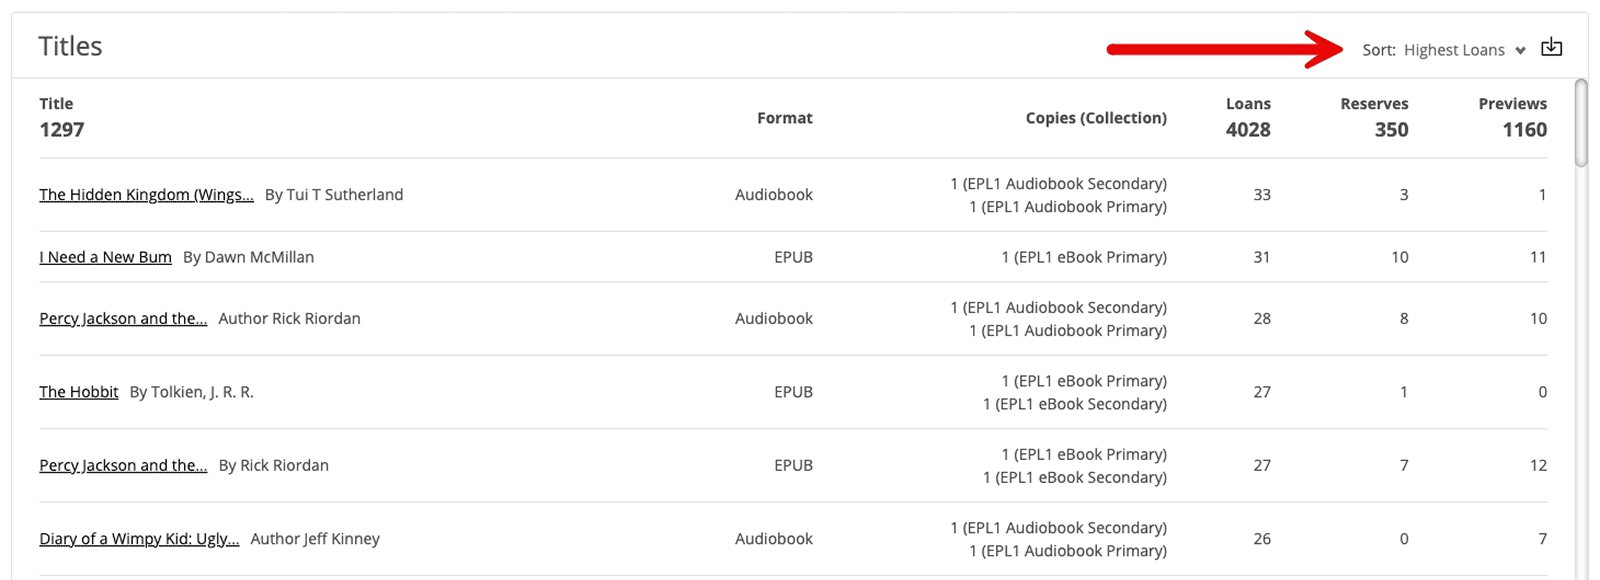
This table provides a comprehensive breakdown of every book in your collection that has had activity during your selected date range. For each title, you can track the number of loans, reserves, and previews, as well as which collection the title belongs to (Primary or Secondary).
Use the Sort dropdown at the top right to organise the table by your most or least popular content. If you need to manipulate this data further or include it in a spreadsheet, click the Export icon (the tray with an arrow) located next to the sort dropdown to download the table as a CSV file.
Titles by Top Category
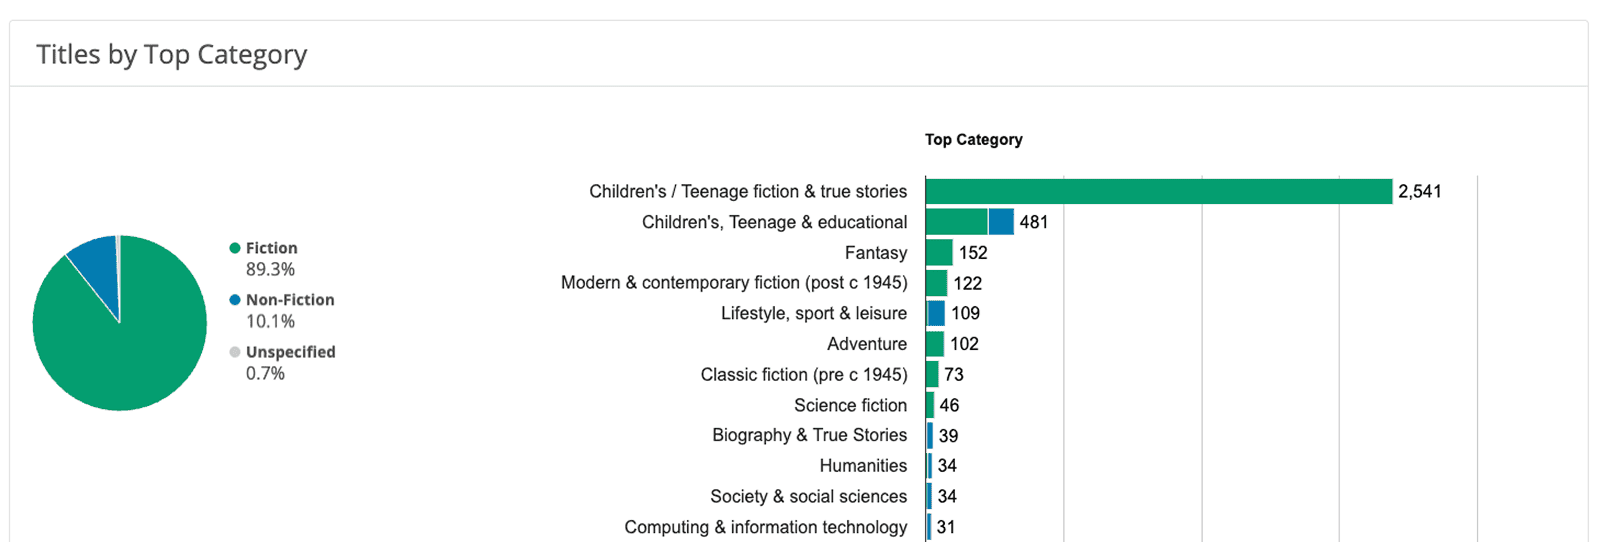
This donut chart shows you exactly how your students are accessing their books. You can toggle between Loans and Reserves to see if students prefer using the ePlatform Web Portal, the Android/iOS Apps, or via your school's LMS.
Patrons
The Patrons tab provides detailed insights into individual student engagement and broader reading trends across your school's different year and age groups. This data is invaluable for identifying your super-readers and pinpointing specific year levels that may need extra encouragement.
Patrons Table
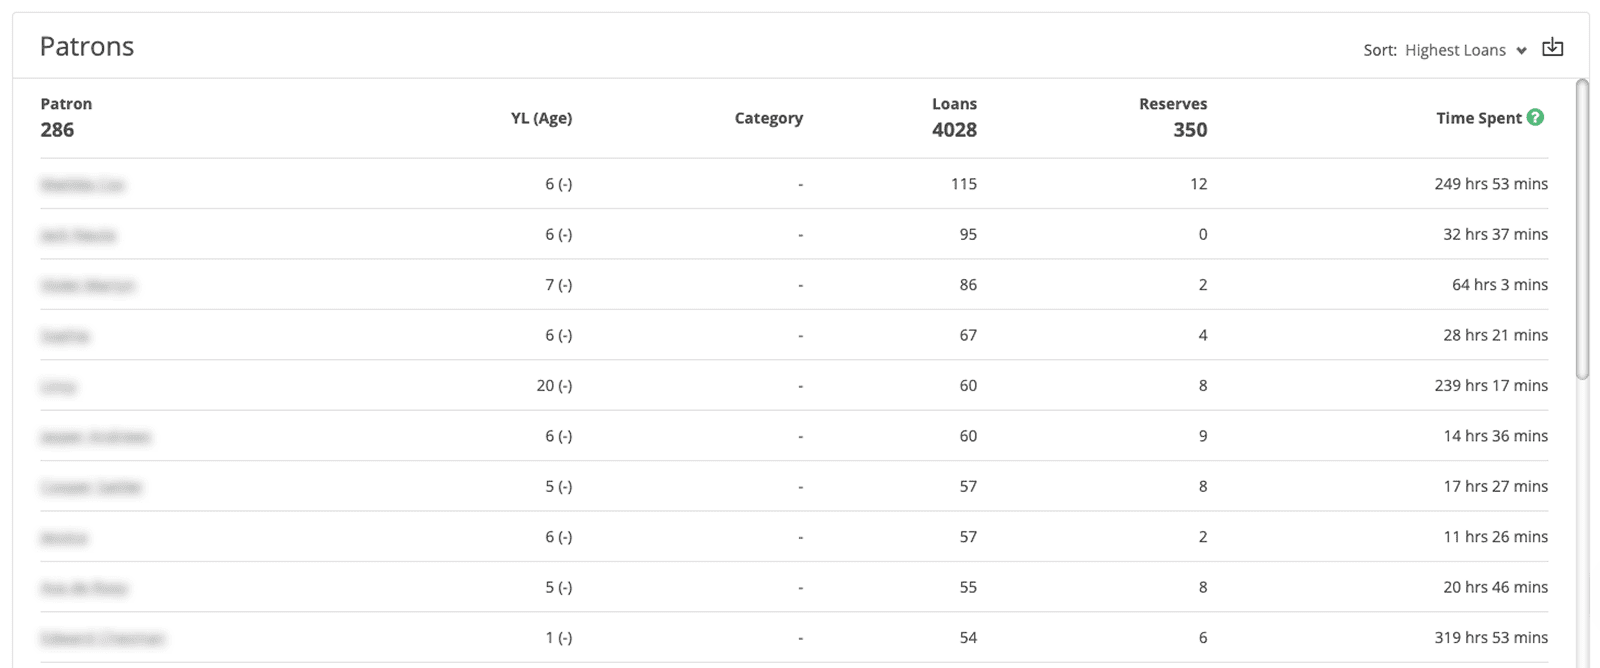
This table lists every student or staff user (patron) who has used the library within your selected time frame. For each individual, you can track their Year Level/Age, the total number of Loans and Reserves, and even the total Time Spent reading on the platform.
Use the Sort dropdown at the top right to organise the table by your most active or least active readers based on loans or reserves. If you need to manipulate this data further for school reports or reward assemblies, click the Export icon (the tray with an arrow) located next to the sort dropdown to download the full list as a CSV file.
Patrons by Year Level, Age, or Category
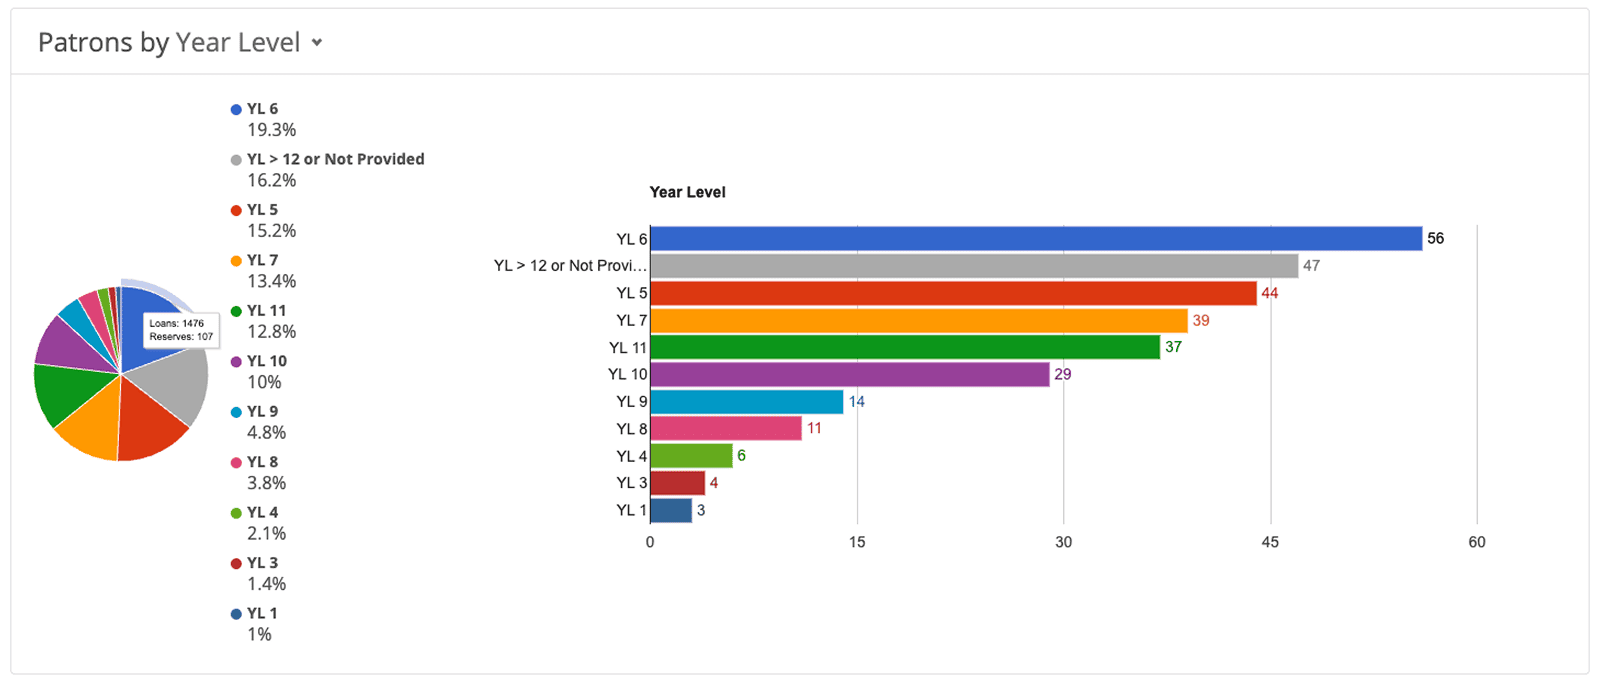
This section provides a visual breakdown of your library's reach across the school. You can toggle the charts to display data by Year Level, Age, or Category to see which groups are the most engaged. The bar chart specifically ranks these groups by the total number of active patrons, helping you identify which segments of your school are leading the way in digital reading.
Advanced Reports
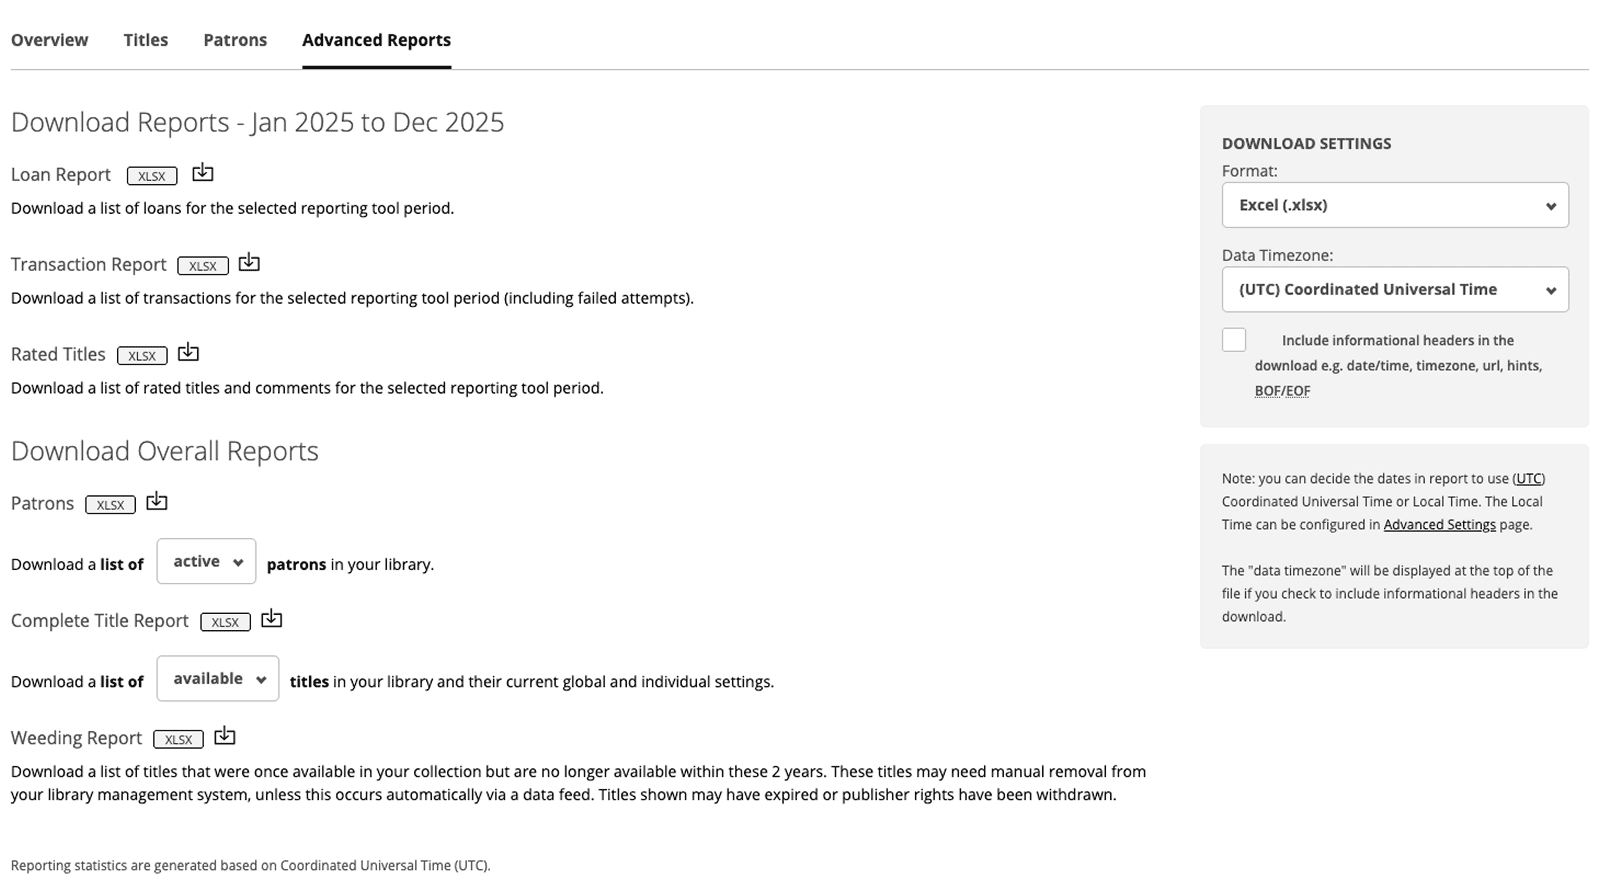
The Advanced Reports tab allows you to generate and download granular data files for your school's records or for integration with other school systems. These reports go beyond visual charts to provide raw data in a format ready for deep analysis.
Before downloading, use the Download Settings panel on the right to choose your preferred file format, such as Excel (.xlsx) or CSV, and select whether the data reflects UTC or your Local Time. You can also choose to include informational headers to provide context for the exported data. Please note: Reporting statistics are generated based on Coordinated Universal Time (UTC).
It is important to remember that these reports will generate data based on the filters you have applied at the top of the page. Ensure these are set to your requirements before downloading.
Frequently Asked Questions
What exactly qualifies as an "Active Patron"?
An Active Patron is any student or staff member who has borrowed or reserved at least one title within your selected date range. For example, your school may have 1,000 students (total patrons), but if only 600 have interacted with a book, your dashboard will show 600 Active Patrons.
What does "Active Titles" mean?
A title is considered "Active" if it has been borrowed, reserved, or previewed at least once during the time period. This helps you see how much of your collection is actually being utilised versus sitting idle.
How accurate is the "Reading Time" metric?
Reading Time shows how long a patron has had a book open in the mobile app or web browser. While this gives a general idea of student engagement, it measures how long the book was open rather than tracking exactly how much text was read. It should be used as a guide to engagement trends rather than as a precise measure of reading volume.
What counts towards "Previews per Month"?
This metric tracks the number of times patrons have opened an eBook preview or played an Audiobook sample. It is a great way to gauge student interest and "window shopping" behaviour before they commit to a full loan.
Can I see data for a specific class or teacher?
While the main Analytics dashboard shows school-wide trends, you can get granular data for specific groups by using the Class Reports feature. This allows you to filter reading statistics by the custom classes you have created.
Why can't I see my Decodable Readers data in the main Analytics area?
Decodable and Levelled Readers analytics and reports are kept in the dedicated Decodables area. There, you can access the Analytics Overview and the Patron Progress Report, which show specific phonetic-level completion and individual student mastery that isn't captured in the general library analytics.
Why are my reports showing times that differ from my local time?
By default, ePlatform reporting statistics are recorded in Coordinated Universal Time (UTC). In the Advanced Reports tab, use the "Download Settings" panel to toggle export to your Local Time so the data aligns perfectly with your school's schedule.