Viewing Usage Analytics
ePlatform Analytics provides real-time information about loans, reserves, previews, active patrons, active titles, and reading activity.
Use this information to understand how your digital library is being used, identify reading trends, and support collection-development decisions.
On this page
- Video tutorial
- Open Analytics Overview
- Set the reporting period
- Overview
- Loans per month
- Reserves per month
- Previews per month
- Usage by application
- Title analytics
- Patron analytics
- Class reports
- Decodable and Levelled Reader analytics
- Metric definitions
- Need help?
- Frequently asked questions
Video tutorial
Watch this staff tutorial for an overview of ePlatform Analytics and reports.
Open Analytics Overview
- Sign in to your school’s ePlatform portal as an administrator.
- Open the Admin area.
- Find View Analytics & Reports.
- Select Analytics Overview.
The navigation path is: Admin area → View Analytics & Reports → Analytics Overview.
Set the reporting period
Analytics are calculated using the filters and date range selected at the top of the page.
Check the selected reporting period before interpreting or exporting the results. When comparing different reports, use the same filters and date range so that the figures cover the same activity.
Overview
The Overview tab provides a high-level summary of your school’s ePlatform activity.
The summary contains four key metrics:
- Total Loans: The total number of loans during the selected reporting period.
- Total Reserves: The total number of reserves during the selected reporting period.
- Active Patrons: Patrons who borrowed or reserved at least one title during the selected reporting period.
- Active Titles: Titles that were borrowed, reserved, or previewed at least once during the selected reporting period.
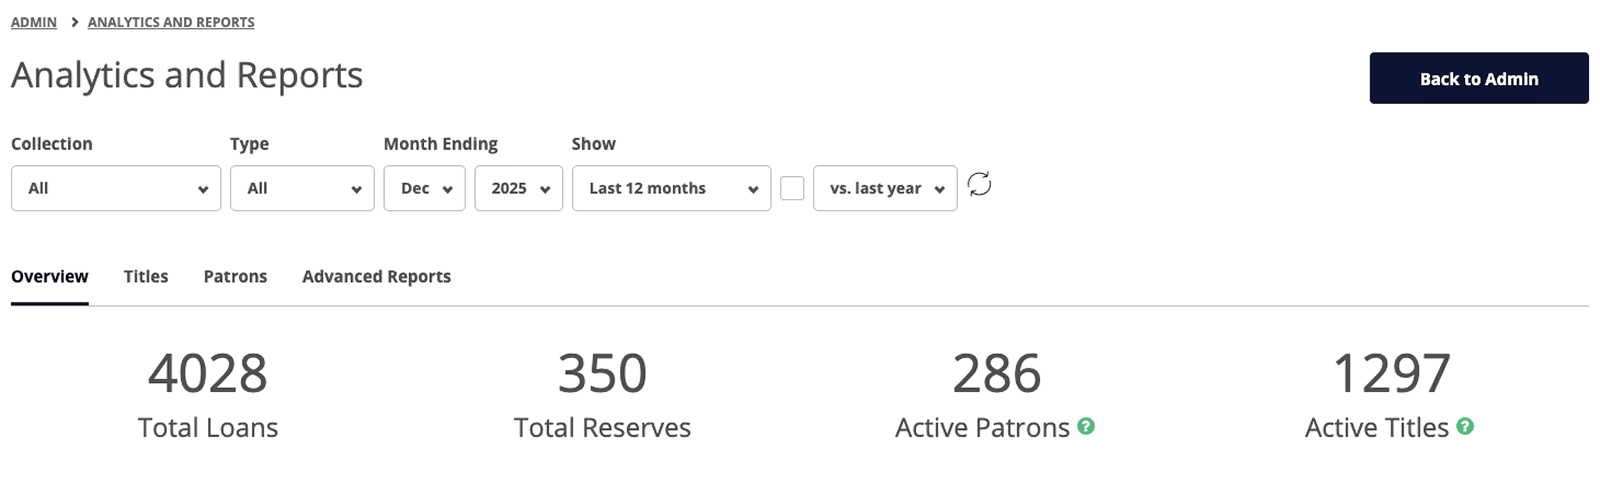
Loans per month
The Loans per month chart shows borrowing trends over the selected reporting period.
The chart separates loans by format and collection:
- Private Collection eBooks;
- Shared Collection eBooks;
- Private Collection Audiobooks; and
- Shared Collection Audiobooks.
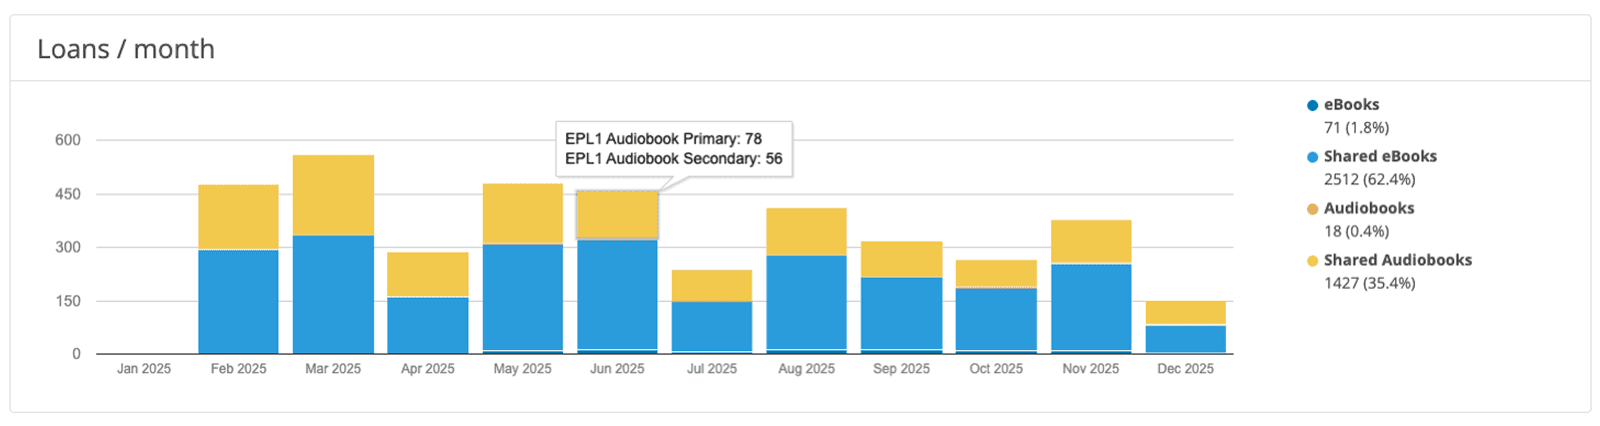
Reserves per month
The Reserves per month chart shows how many titles readers reserved during each month in the selected reporting period.
Use this chart to identify periods of higher demand when readers were waiting for titles.
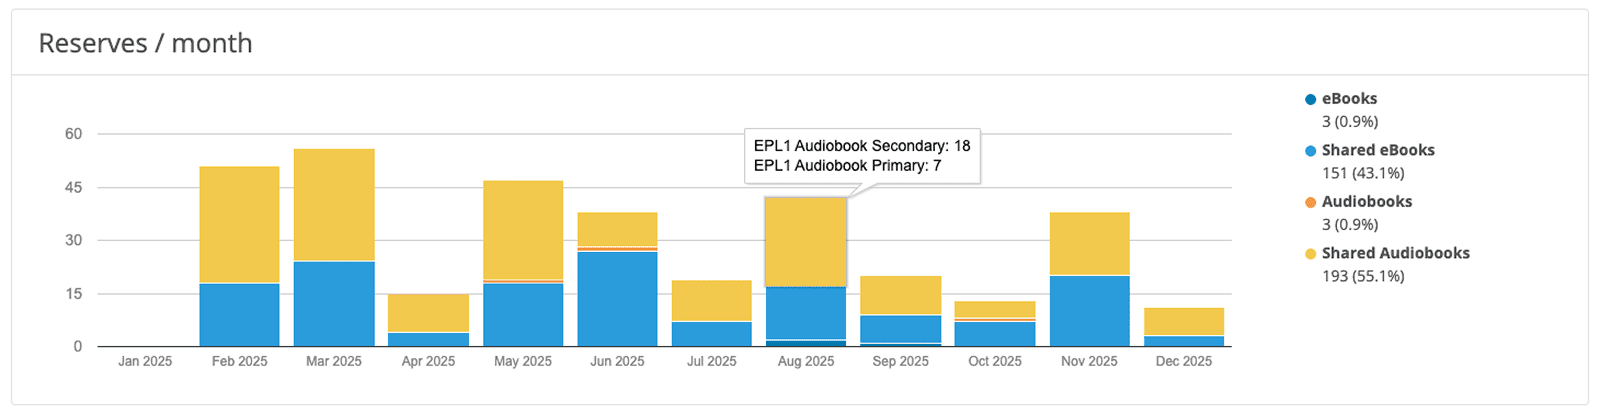
Previews per month
The Previews per month chart shows how often readers opened an eBook preview or played an Audiobook sample before borrowing.
Usage by application
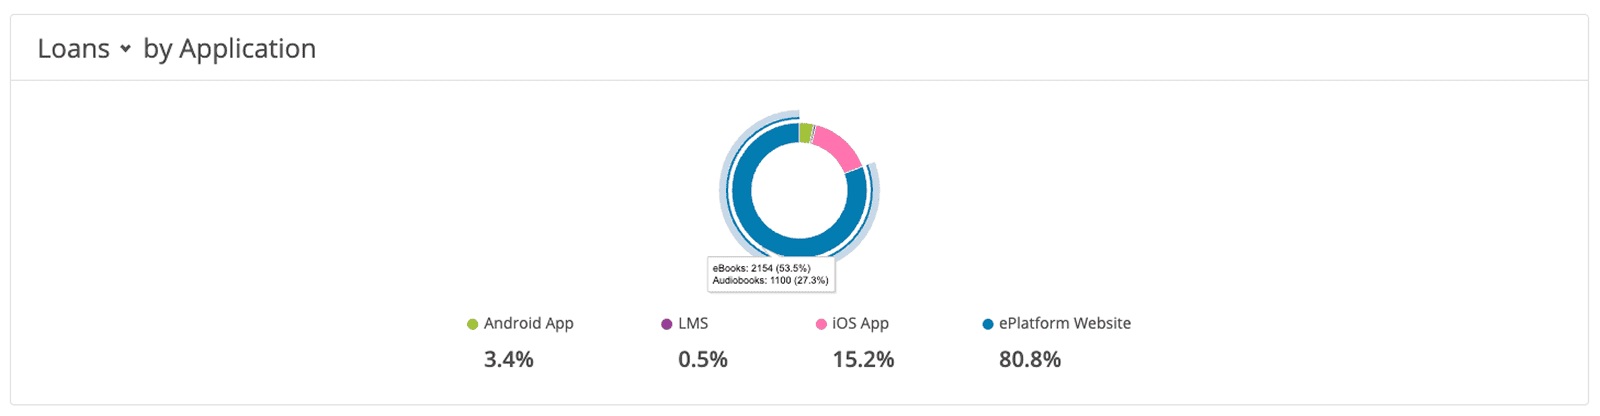
The Usage by Application chart shows how readers access ePlatform.
The applications shown can include:
- the ePlatform web portal;
- the Android or iOS app; and
- the school’s Library Management System.
Toggle between Loans and Reserves to compare how readers use each access method.
Title analytics
Open the Titles tab to review activity for individual books in your collection.
Titles table
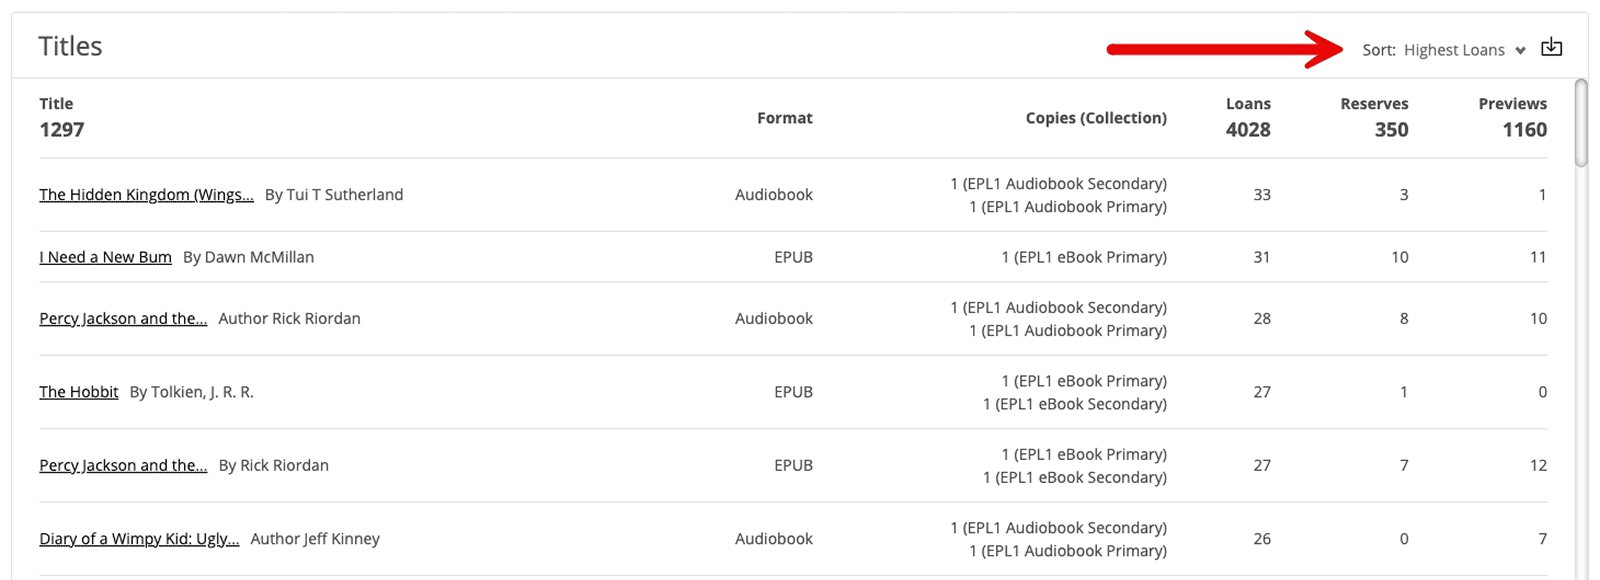
The Titles table lists books that had activity during the selected reporting period.
For each title, you can review:
- loans;
- reserves;
- previews; and
- the collection information shown for the title.
Use the Sort dropdown at the top right to organise the table. To download the displayed data as a CSV file, select the Export icon next to the Sort dropdown.
Titles by Top Category
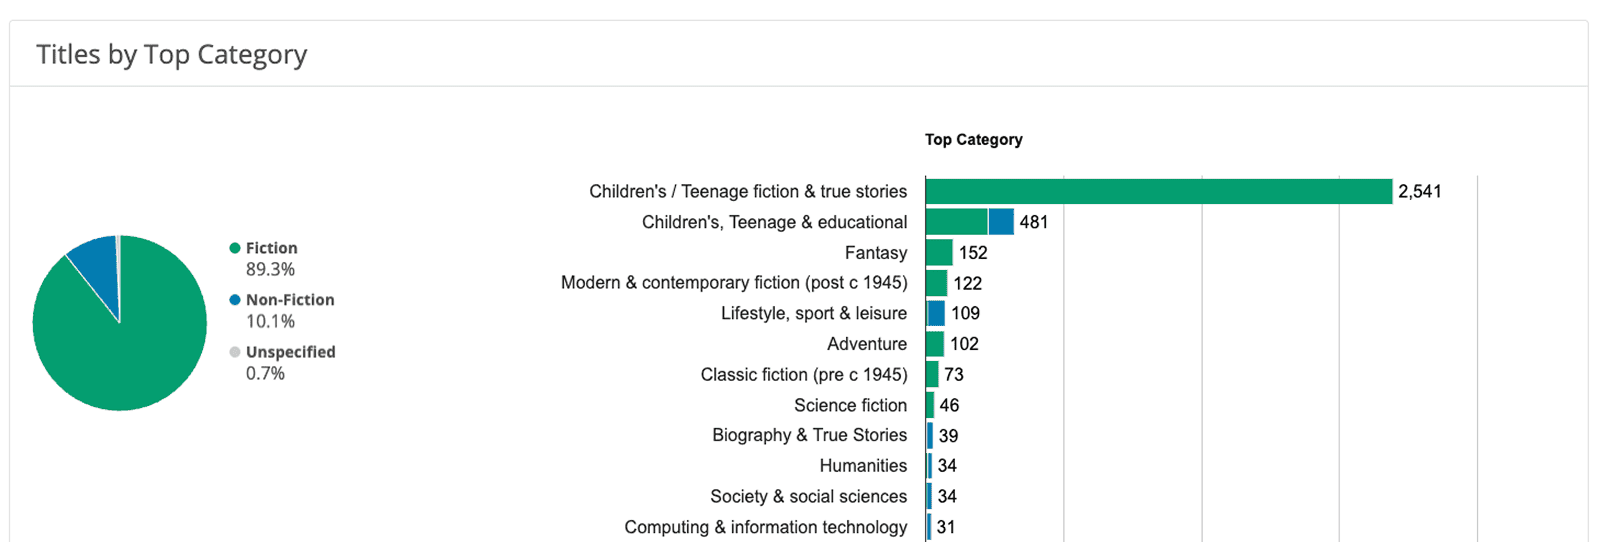
Use the Titles by Top Category chart to review how title activity is distributed across the leading categories in your collection.
Patron analytics
Open the Patrons tab to review individual reader engagement and compare activity across year levels, ages, or categories.
Patrons table
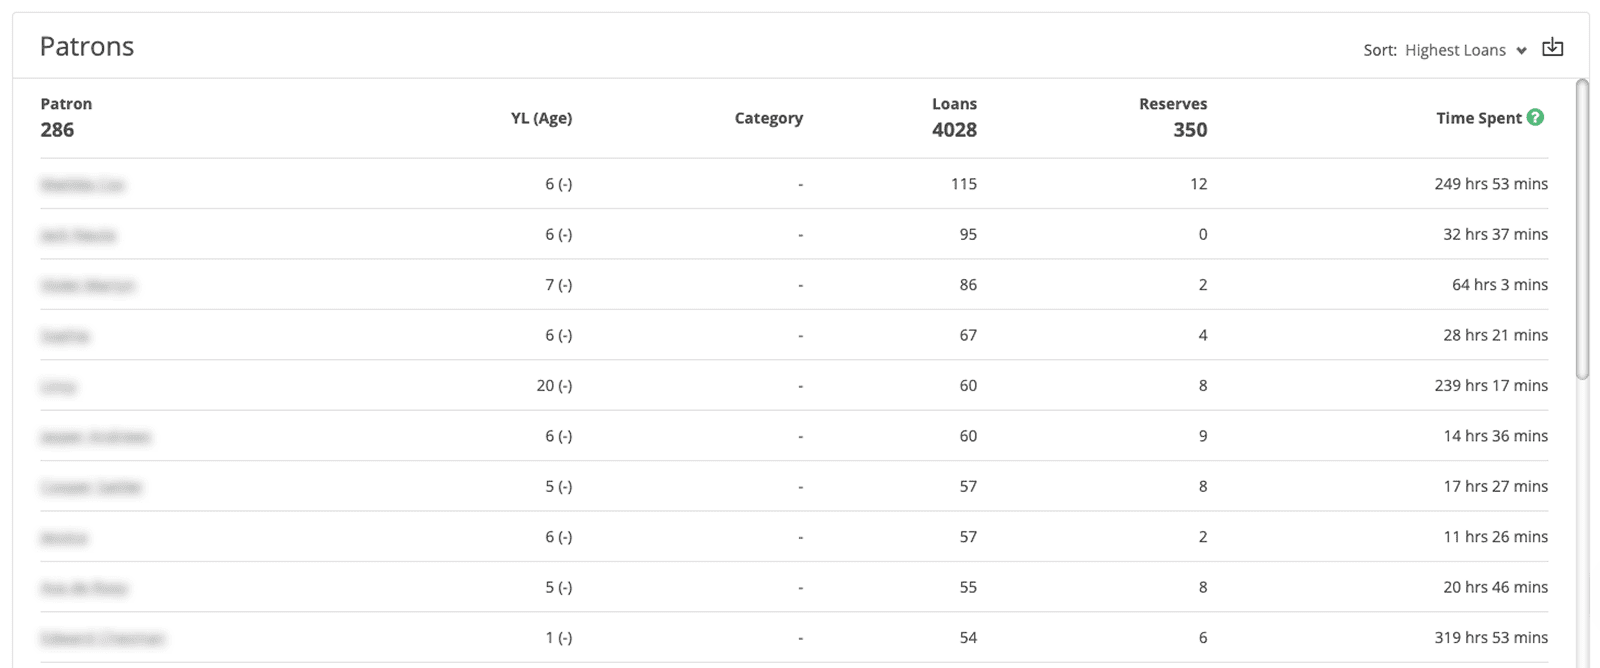
The Patrons table lists students and staff who used the library during the selected reporting period.
For each patron, the available information includes:
- year level or age;
- total loans;
- total reserves; and
- time spent reading in ePlatform.
Use the Sort dropdown to organise the table by reader activity. Select the Export icon beside the Sort dropdown to download the displayed list as a CSV file.
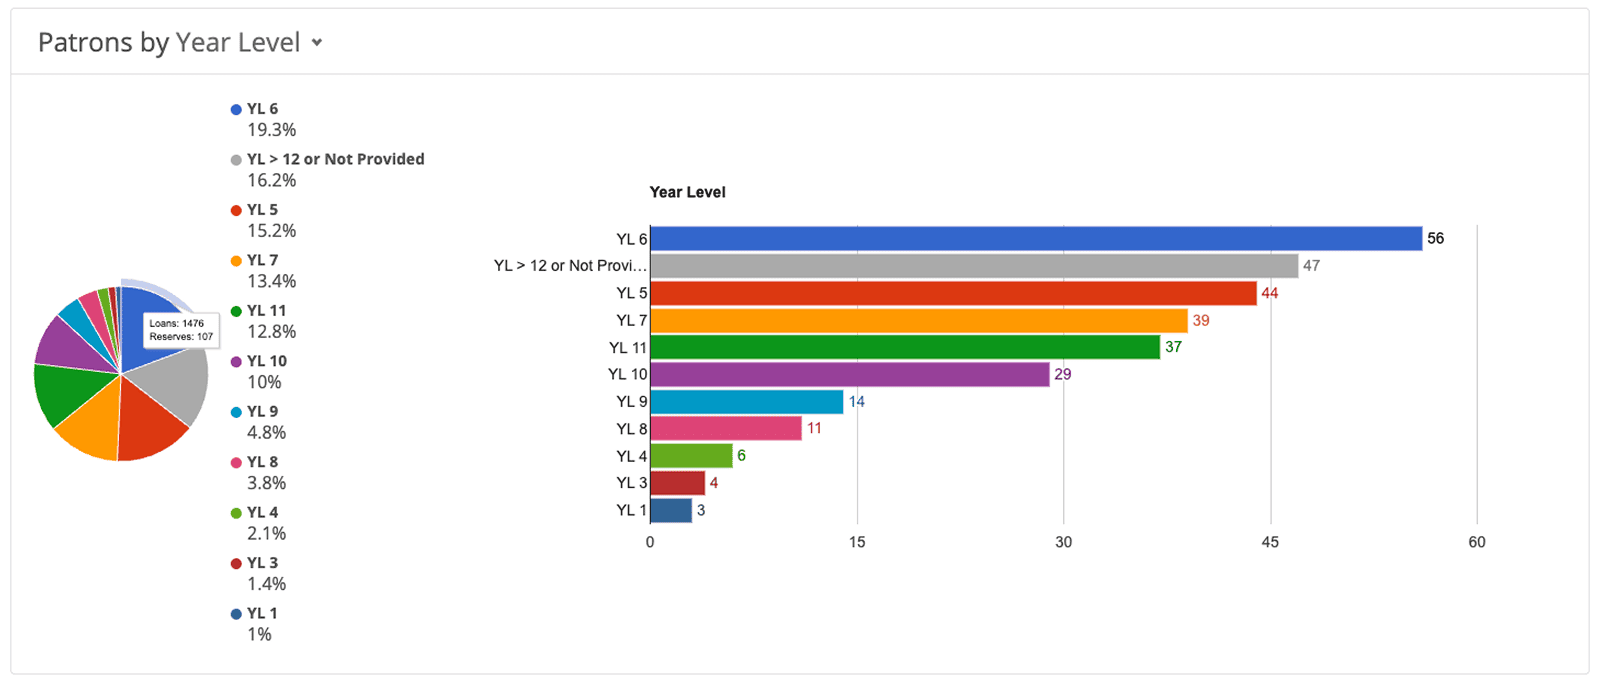
Patrons by Year Level, Age, or Category
Use these charts to compare engagement across different groups in your school.
Toggle the available view between Year Level, Age, or Category. The bar chart ranks the displayed groups by their number of active patrons.
Class reports
The main Analytics area shows school-wide activity. To review information for a specific class, use the Class Reports feature within the class-management area.
Class reports use the classes created in ePlatform and allow you to review reading statistics for those groups.
Decodable and Levelled Reader analytics
Decodable and Levelled Reader activity is included on the main Analytics page and remains available in the dedicated Decodable and Levelled Reader analytics areas.
Administrators can open Admin area → View Analytics & Reports → Analytics Overview, select the required reporting period, and use the filters displayed on the page.
Where a student name has been provided, the report displays that name. If no name has been provided, it displays the patron’s Barcode, which is often the student’s email address.
Metric definitions
What is an Active Patron?
An Active Patron is a student or staff member who borrowed or reserved at least one title during the selected reporting period.
What is an Active Title?
An Active Title is a title that was borrowed, reserved, or previewed at least once during the selected reporting period.
What does Reading Time measure?
Reading Time records how long a patron had a book open in the mobile app or web browser.
It measures how long the book was open rather than exactly how much text the patron read. Use Reading Time as an engagement indicator rather than a precise measurement of reading volume.
What counts as a preview?
A preview is recorded when a patron opens an eBook preview or plays an Audiobook sample.
Frequently asked questions
How do I filter analytics by language, category, or user type?
Open Admin area → View Analytics & Reports → Analytics Overview and use the filters displayed at the top of the page. Apply the same reporting period and filters when comparing results. If the breakdown you need is not available in the displayed filters, contact ePlatform Support.
How do I view individual Decodable or Levelled Reader activity?
Use the Decodable and Levelled Reader information on the main Analytics page or open the dedicated Decodable or Levelled Reader analytics area. A student’s name appears when it has been supplied; otherwise the report uses the patron’s Barcode.
Why does an analytics report show an email address, code, or “Unspecified” instead of a name?
If a student name has not been supplied, ePlatform displays the patron’s Barcode, which may be the student’s email address. If a value shown as “Unspecified” cannot be resolved by checking the patron data and selected filters, contact ePlatform Support.
Need help?
If the Analytics area does not display the information you expect, contact support@eplatform.co.
Please include:
- your school or library name;
- the Analytics tab you were viewing;
- the filters and reporting period selected;
- the information you expected to see;
- any error message displayed; and
- a screenshot of the affected Analytics page.
Avoid including unnecessary personal information about students or staff.